Monday, January 31, 2011

M-estimators

Anyone that has had a basic statistics course is familiar with the idea that the mean can be biased, or influenced by outliers. Basic mathematical statistics shows that the estimator for the mean can be derived by the method of least squares  i.e. min  ∑ (x-c) where c* = mean(x),  or if we specify a likelihood function using the Gaussian distribution, the  estimator for the mean can be derived using maximum likelihood.
M-estimators generalize least squares and maximum likelihood, having certain properties that minimize sensitivity to outliers. 

M-estimators address sensitivity to outliers by replacing (x-c) with another function that gives less weight to extreme values, which otherwise can exert leverage or 'pull' mean estimates in the direction of the tail of a distribution.  

Wilcox provides a basic expression for deriving an M-estimator:

Choose  μ m  to  satisfy  ∑ ψ (xim )/ τ  =0

 τ  = a measurement of scale

In Hoaglin, Mosteller, & Tukey a more detailed expression is given:

M-estimators are a family of estimators, all involving the same scale measure or auxiliary scale parameter, the value of the tuning constant determining the individual member of the family.

Choose Tn to satisfy  ∑ ψ (xi -Tn )/ cSn = 0

Sn = auxillary estimator of scale 
c = tuning constant

Properties of M-Estimators:

In Hoaglin,  Mosteller, and Tukey, Goodall describes two important properties of robust M-estimators:

Resistance: an estimator is resistant if it is altered to only a limited extent by a small proportion of outliers. The estimator breaks down if the proportion becomes too large. 

Robustness of Efficiency: over a range of distributions, the variance (or mean squared error) is close to minimum for each distribution.  This guarantees an estimator is good when repeated samples are drawn from a distribution that is not known precisely. 

Goodall give examples of M-estimators including Tukey's biweight, Huber's, or Andrew's Wave.

References:

Introduction to Robust Estimation and Hypothesis Testing. 2nd Edition. Rand R. Wilcox.  Elsevier. 2005.

Understanding Robust and Explorotory Data Analysis. David C. Hoaglin. Frederick Mosteller. John W. Tukey. Wiley. 1983


Culture War: Classical Statistics vs Machine Learning

 'Statistical Modeling: The Two Cultures' by L. Breiman (Statistical Science
2001, Vol. 16, No. 3, 199–231) is an interesting paper that is a must read for anyone traditionally trained in statistics, but new to the concept of machine learning. It gives  perspective and context to anyone that may attempt to learn to use data mining software such as  SAS Enterprise Miner or who may take a course in machine learning  (like Dr. Ng's (Stanford) youtube lectures in machine learning .) The algorithmic machine learning paradigm is in great contrast to the traditional probabilistic approaches of 'data modeling' in which I had been groomed both as an undergraduate and in graduate school.

From the article, two cultures are defined:

"There are two cultures in the use of statistical modeling to reach conclusions from data.

Classical Statistics/Stochastc Data Modeling Paradigm:

" assumes that the data are generated by a given stochastic data model. "

Algorithmic or Machine Learning Paradigm:

"uses algorithmic models and treats the data mechanism as unknown."

In a lecture  for Eco 5385
 Data Mining Techniques for Economists
, Professor  Tom Fomby
 of Southern Methodist University distinguishes machine learning from classical statistical techniques:

Classical Statistics: Focus is on hypothesis testing of causes and effects and interpretability of models.  Model Choice is based on parameter significance and In-sample Goodness-of-fit.

Machine Learning:  Focus is on Predictive Accuracy even in the face of lack of interpretability of models.  Model Choice is based on Cross Validation of Predictive Accuracy using Partitioned Data Sets.

For some, this distinction may be made more transparent by comparing the methods used under each approach. Professor Fomby makes these distinctions:

Methods Classical Statistics:  Regression, Logit/Probit, Duration Models, Principle Components, Discriminant Analysis, Bayes Rules

Artificial Intelligence/Machine Learning/Data Mining: Classification and Regression Trees, Neural Nets, K-Nearest Neighbors, Association Rules, Cluster Analysis

From the standpoint of econometrics, the data modeling culture is described very well in this post by Tim Harford:

"academic econometrics is rarely used for forecasting. Instead, econometricians set themselves the task of figuring out past relationships. Have charter schools improved educational standards? Did abortion liberalisation reduce crime? What has been the impact of immigration on wages?"

The methodologies referenced in the article (like logistic regression)  that are utilized under the data modeling or classical statistics paradigm are a means to fill what Brieman refers to as a black box. Under this paradigm analysts are attempting to characterize an outcome by estimating parameters and making inferences about them based on some assumed data generating process. It is not to say that these methods are never used under the machine learning paradigm, but how they are used. The article provides a very balanced 'ping-pong' discussion citing various experts from both cultures, including some who seem to promote both including the authors of The Elements of Statistical Learning: Data Mining, Inference, and Prediction.

In my first econometrics course, the textbook cautioned against 'data mining,' described as using techniques such as stepwise regression. It insisted on letting theory drive model development, rating the model on total variance explained, and the significance of individual coefficients. This advice was certainly influenced by the 'data modeling' culture. The text was published in the same year as the Breiman article.

Of course, as the article mentions, if what you are interested in is theory and the role of particular variables in underlying processes, then traditional inference seems to be appropriate.

When algorithmic models are more appropriate (especially when the goal is prediction) a stoachastic model designed to make inferences about specific model co-efficients may provide "the right answer to the wrong question" as Emanuel Parzen puts it in his comments on Breiman.


Keeping an Open Mind: 'Multiculturalism' in Data Science

As  Breiman states:

"Approaching problems by looking for a data model imposes an apriori straight jacket that restricts the ability of statisticians to deal with a wide range of statistical problems."

As Parzen states "I believe statistics has many cultures." He points out that many practitioners are well aware of the divides that exist between Bayesians and frequentists, algorithmic approaches aside. Even if we restrict our tool box to stochastic methods, we can often find our hands tied if we are not open minded or understand the social norms that distinguish theory from practice.  And there are plenty of divisive debates, like the use of linear probability models for one.


This article was updated and abridged on December 2, 2018.

Saturday, January 29, 2011

Which variables are the most important?

Often, after conducting an analysis, I've been asked which variables are the most important? While a simple and practical question, the ways of answering it are not always simple or practical. Professor David Firth of Oxford assembled a very useful literature review addressing this topic which can be found here.

In a critique of The Bell Curve  Goldberger and Manski offer the following:

Artheur S. Goldberger and Charles F. Manski  in Journal of Economic Literature Vol. XXXIII (June 1995), pp. 762-776

"We must still confront HM's interpretation of the relative slopes of the two curves in Figure 1 as measuring the "relative importance" of cognitive ability and SES in determining poverty status.
Standardization in the manner of HM-essentially using "beta weights"-has been a common practice in sociology, psychology, and education. Yet it is very rarely encountered in economics. Most econometrics text- books do not even mention the practice. The reason is that standardization accomplishes nothing except to give quantities in noncom- parable units the superficial appearance of being in comparable units. This accomplishment is worse than useless-it yields misleading inferences.
"

"We find no substantively meaningful way to interpret the empirical analysis in Part II of The Bell Curve as showing that IQ is "more important" than SES as a determinant of social behaviors....The Coleman Report sought to measure the "strength" of the relationship between various school factors and pupil achievement through the percent of variance explained by each factor, an approach similar to that of HM. Cain and Watts write (p. 231): "this measure of strength is totally inappropriate for the purpose of informing policy choice, and cannot provide relevant information for the policy maker."

Again, this goes back to Leamer's discussion of the current state of econometrics on EconTalk, as well as Brieman's comments of variable importance in Statistical Modeling: The Two Cultures

"My definition of importance is based on prediction. A variable might be considered important if deleting it seriously affects prediction accuracy...Importance does not yet have a satisfactory theoretical definition...It depends on the dependencies between the output variable and the input variables, and on the dependencies between the input variables. The problem begs for research."


In A Guide to Econometrics Kennedy presents multiple regression in the context of the Ballentine Venn diagram and explains: (click to enlarge)
 
“.. the blue-plus-red-plus-green area represents total variation in Y explained by X and Z together (X1 & X2 in my adapted diagram above)….the red area is discarded only for the purpose of estimating the coefficients, not for predicting Y; once the coefficients are estimated, all variation in X and Z is used to predict Y…Thus, the R2 resulting from multiple regression is given by the ratio of the blue-plus-red-plus-green area to the entire Y circle. Notice there is no way of allocating portions of total R2 to X and Z because the red area variation is explained by both, in a way that cannot be disentangled. Only if X and Z are orthogonal, and the red area disappears, can total R2 be allocated unequivocally to X and Z separately.”

So on a theoretical basis, total variance explained is out. Probably better answers revolve around the notion that all significant variables are important. However,  Ziliak and  McCloskey argue against this approach:

"Significant does not mean important and insignificant does not mean unimportant"

The thing to bear in mind, in absence of theoretical justification, there are questions that need answering. Perhaps a number of practical approaches should be embraced, including some of those criticized above.

(for an interesting discussion of this topic on google groups see here)

Is inference valid for population data?

This is a question that puzzled me. After going through several undergraduate courses in statistical inference, and a rigorous theoretical treatment in graduate school, I felt at a loss. Suddenly, (so I thought) I was dealing with population data, not sample data. Should I eschew the use of confidence intervals and levels of significance? Do calculated differences between groups using population data represent 'the' difference between groups?

From a post entitled “How does statistical analysis differ when analyzing the entire population rather than a sample? professor Andrew Gelman states:

 “So, one way of framing the problem is to think of your "entire population" as a sample from a larger population, potentially including future cases. Another frame is to think of there being an underlying probability model. If you're trying to understand the factors that predict case outcomes, then the implicit full model includes unobserved factors (related to the notorious "error term") that contribute to the outcome. If you set up a model including a probability distribution for these unobserved outcomes, standard errors will emerge.”

Culture War: Classical Statistics vs. Machine Learning

 'Statistical Modeling: The Two Cultures' by L. Breiman (Statistical Science
2001, Vol. 16, No. 3, 199–231) is an interesting paper that is a must read for anyone traditionally trained in statistics, but new to the concept of machine learning. It gives  perspective and context to anyone that may attempt to learn to use data mining software such as  SAS Enterprise Miner or who may take a course in machine learning  (like Dr. Ng's (Stanford) youtube lectures in machine learning .) The algorithmic machine learning paradigm is in great contrast to the traditional probabilistic approaches of 'data modeling' in which I had been groomed both as an undergraduate and in graduate school.

From the article, two cultures are defined:

"There are two cultures in the use of statistical modeling to reach conclusions from data.

Classical Statistics/Stochastc Data Modeling Paradigm:

" assumes that the data are generated by a given stochastic data model. "

Algorithmic or Machine Learning Paradigm:

"uses algorithmic models and treats the data mechanism as unknown."

In a lecture  for Eco 5385
 Data Mining Techniques for Economists
, Professor  Tom Fomby
 of Southern Methodist University distinguishes machine learning from classical statistical techniques:

Classical Statistics: Focus is on hypothesis testing of causes and effects and interpretability of models.  Model Choice is based on parameter significance and In-sample Goodness-of-fit.

Machine Learning:  Focus is on Predictive Accuracy even in the face of lack of interpretability of models.  Model Choice is based on Cross Validation of Predictive Accuracy using Partitioned Data Sets.

For some, this distinction may be made more transparent by comparing the methods used under each approach. Professor Fomby does a great job making these distinctions:

Methods Classical Statistics:  Regression, Logit/Probit, Duration Models, Principle Components, Discriminant Analysis, Bayes Rules

Artificial Intelligence/Machine Learning/Data Mining: Classification and Regression Trees, Neural Nets, K-Nearest Neighbors, Association Rules, Cluster Analysis
 
From the standpoint of econometrics, the data modeling culture is described very well in this post by Tim Harford:

"academic econometrics is rarely used for forecasting. Instead, econometricians set themselves the task of figuring out past relationships. Have charter schools improved educational standards? Did abortion liberalisation reduce crime? What has been the impact of immigration on wages?"

This is certainly consistent with the comparisons presented in the Statistical Science article. Note however, that the methodologies referenced in the article (like logistic regression)  that are utilized under the data modeling or classical statistics paradigm are a means to fill what Brieman refers to as a black box. Under this paradigm analysts are attempting to characterize an outcome by estimating parameters and making inferences about them based on some assumed data generating process. It is not to say that these methods are never used under the machine learning paradigm, but how they are used. The article provides a very balanced 'ping-pong' discussion citing various experts from both cultures, including some who seem to promote both including the authors of The Elements of Statistical Learning: Data Mining, Inference, and Prediction.

In my first econometrics course, the textbook cautioned against 'data mining,' described as using techniques such as stepwise regression. It insisted on letting theory drive model development, rating the model on total variance explained, and the significance of individual coefficients. This advice was certainly influenced by the 'data modeling' culture. The text was published in the same year as the Breiman article. ( I understand this caution has been moderated in contemporary editions).
Of course, as the article mentions, if what you are interested in is theory and the role of particular variables in underlying processes, then traditional inference seems to be the appropriate direction to take. (Breiman of course still takes issue, arguing that we can't trust the significance of an estimated co-efficient if the model overall is a poor predictor).

"Higher predictive accuracy is associated with more reliable information about the underlying data mechanism. Weak predictive accuracy can lead to questionable conclusions."

"Algorithmic models can give better predictive accuracy than data models,and provide better information about the underlying mechanism.
"

"The goal is not interpretability, but accurate information."

When algorithmic models are more appropriate (especially when the goal is prediction) a stoachastic model designed to make inferences about specific model co-efficients may provide "the right answer to the wrong question" as Emanuel Parzen puts it in his comments on Breiman.


I even find a hint of this in Greene, a well known econometrics textbook author:

 "It remains an interesting question for research whether fitting y well or obtaining good parameter estimates is a preferable estimation criterion. Evidently, they need not be the same thing."
  p. 686 Greene,  Econometric Analysis 5th ed

Keeping an Open Mind: Multiculturalism in Data Science

As  Breiman states:

"Approaching problems by looking for a data model imposes an apriori straight jacket that restricts the ability of statisticians to deal with a wide range of statistical problems."

A multicultural approach to analysis (stochastic or algorithmic) seems to be the take away message of the Breiman article and discussions that follow. The field  data science, and as clearly depicted in Drew Conway's  data science Venn diagram is multi-pillared:  


Parzen points out that many practitioners are well aware of the divides that exist between Bayesians and frequentists, algorithmic approaches aside. Even if we restrict our tool box to stochastic methods, we can often find our hands tied if we are not open minded or understand the social norms that distinguish theory from practice.  And there are plenty of divisive debates, like the use of linear probability models for one.

As Parzen states "I believe statistics has many cultures."  We will be a much more effective in our work and learning if we have this understanding, and embrace rather than fight the diversity of thought across various fields of science and each discipline's differing social norms and practices. Data science at best, is an interdisciplinary field of study and work.

This article was updated and abridged on December 2, 2014.

Sunday, January 23, 2011

Merging Multiple Data Frames in R

Earlier I had a problem that required merging 3 years of trade data, with about 12 csv files per year. Merging all of these data sets with pairwise left joins using the R merge statement worked (especially after correcting some errors pointed out by Hadley Wickham However, in both my hobby hacking and on the job, I was curious if there might be a better way to do this than countless sets of merge statements (not to mention the multiple lines of code required for reading in the csv files)

So, I sent a tweet to the #rstats followers with a link to where I posted the problem on this blog to see if I could get a hint. (twitter has been a very valuable networking tool for me, I've learned a lot about data mining, machine learning, and R from the tweet-stream. Tweets and blog posts from people like Hadley Wickham, Drew Conway, and J.D. Long have been tremendously helpful to me as I've taken up R.

Back to the topic at hand, below is my new code, based on suggestions from Hadley Wickham and a comment (from Harlan) that lead me to some answers to a similar question on stack overflow. The code below requires he reshape library as well as plyr, which I should mention appears to have been created by Hadley Wickham himself.

# read all Y2000 csv files
 
filenames <- list.files(path="/Users/wkuuser/Desktop/R Data Sets/TRADE_DATA/TempData00", full.names=TRUE)
import.list <- llply(filenames, read.csv)
 
# left join all Y2000 csv files
 
AllData00 <- Reduce(function(x, y) merge(x, y, all=FALSE,by.x="Reporting.Countries.Partner.Countries",by.y="Reporting.Countries.Partner.Countries",all.x =TRUE, all.y =FALSE),import.list,accumulate=F)
 
dim(AllData00) # n = 211 211
 
# rename common key variable to something less awkward and change World to World00
 
AllData00 <- rename(AllData00, c(Reporting.Countries.Partner.Countries="Partner", World = "World00"))
names(AllData00) # list all variable names
 
# keep only the partner name variable and total world trade
 
AllData00 <-AllData00[c("Partner","World00")]
 
dim(AllData00) # data dimensions
names(AllData00) # variable names
fix(AllData00)  # view in data editor
Created by Pretty R at inside-R.org

That  pretty well gives me the data set I need, for year 2000 data. I repeated the process for 2004 and 2008 data sets I had and then merged them with left joins to get the final data set. All I am after at this point is the total world trade for each of the countries/groups listed. This could probably be made even more efficient, but is is a lot less coding than what I initially used for the project. (see below- and this doesn't even include some of the renaming and sub-setting functions I performed above) And, this process would have to be repeated 2 more times for 2004 and 2008 data. To say that the above code is much more efficient is an understatement. (note the code below actually contains some mistakes as Hadley Wickham pointed out. For instance, in the merge statement, I have by.a and by.b, or by.'dataset', while in every case it should be by.x and by.y. I guess x and y are alias's for the data sets being merged, sort of like a and b would be in SQL, if you were to say:

create table newdataset as
select *
from dat1 a left join dat2 b
on a.partner=b.partner

So, I'm not sure why my code even worked to begin with. I do realize that instead of the merge statement in R I could have used the sqldf package in R, but I have had issues with my mac crashing when I try to load the library. Still, I don't think SQL would have made things any better, as I would still be doing a series of left joins vs. the more compact code using the reduce function in R. I've used sqldf in a windows environment before and it worked great by the way.

The code below first reads in each data file individually, and then executes the endless number of left joins to give me the same data set I got above with a fraction of the amount of required code. 

#  a
 a <- read.csv("X_A.csv", na.strings=c(".", "NA", "", "?"), encoding="UTF-8")
 names(a)
 
 a <- rename(a, c(Reporting.Countries.Partner.Countries="Partner"))
 names(a)
 dim(a)
 
 #  b
 b <- read.csv("X_B.csv", na.strings=c(".", "NA", "", "?"), encoding="UTF-8")
 names(b)
 
 b <- rename(b, c(Reporting.Countries.Partner.Countries="Partner"))
 names(b)
 dim(b)  
 
 #  c
 c <- read.csv("X_C.csv", na.strings=c(".", "NA", "", "?"), encoding="UTF-8")
 names(c)
 
 c <- rename(c, c(Reporting.Countries.Partner.Countries="Partner"))
 names(c)
 dim(c)   
 
 #  de
 de <- read.csv("X_DE.csv", na.strings=c(".", "NA", "", "?"), encoding="UTF-8")
 names(de)
 
 de <- rename(de, c(Reporting.Countries.Partner.Countries="Partner"))
 names(de)
 dim(de) 
 
 #  fgh
 fgh <- read.csv("X_FGH.csv", na.strings=c(".", "NA", "", "?"), encoding="UTF-8")
 names(fgh)
 
 fgh <- rename(fgh, c(Reporting.Countries.Partner.Countries="Partner"))
 names(fgh)
 dim(fgh) 
 
 #  ijk
 ijk <- read.csv("X_IJK.csv", na.strings=c(".", "NA", "", "?"), encoding="UTF-8")
 names(c)
 
 ijk <- rename(ijk, c(Reporting.Countries.Partner.Countries="Partner"))
 names(ijk)
 dim(ijk) 
 
 #  lm
 lm <- read.csv("X_LM.csv", na.strings=c(".", "NA", "", "?"), encoding="UTF-8")
 names(lm)
 
 lm <- rename(lm, c(Reporting.Countries.Partner.Countries="Partner"))
 names(lm)
 dim(lm)
 
 #  nop
 nop <- read.csv("X_NOP.csv", na.strings=c(".", "NA", "", "?"), encoding="UTF-8")
 names(nop)
 
 nop <- rename(nop, c(Reporting.Countries.Partner.Countries="Partner"))
 names(nop)
 dim(nop) 
 
 #  qr
 qr <- read.csv("X_QR.csv", na.strings=c(".", "NA", "", "?"), encoding="UTF-8")
 names(qr)
 
 qr <- rename(qr, c(Reporting.Countries.Partner.Countries="Partner"))
 names(qr)
 dim(qr)
 
 
 #  s  odd name changed to 'SaloTomaPrincip' manaully in excel
 s <- read.csv("X_S.csv", na.strings=c(".", "NA", "", "?"), encoding="UTF-8")
 names(s)
 
 s <- rename(s, c(Reporting.Countries.Partner.Countries="Partner"))
 names(s)
 dim(s) 
 
 #  tuv
 tuv <- read.csv("EX_TUV.csv", na.strings=c(".", "NA", "", "?"), encoding="UTF-8")
 names(tuv)
 
 tuv <- rename(tuv, c(Reporting.Countries.Partner.Countries="Partner"))
 names(tuv)
 dim(tuv)
 
 
 #  wxyz
 wxyz <- read.csv("X_WXYZ.csv", na.strings=c(".", "NA", "", "?"), encoding="UTF-8")
 names(wxyz)
 
 wxyz <- rename(wxyz, c(Reporting.Countries.Partner.Countries="Partner"))
 names(wxyz)
 dim(wxyz)  
 
 
# ------------------------------------------------------------------
#  sequentially left join data sets
# ------------------------------------------------------------------ 
 
 
 # a & b 
 
 ab <- merge(a,b, by.a = Partner, by.b =Partner, all = FALSE, all.x = TRUE, all.y = FALSE)
 dim(ab)
 names(ab) 
 14 + 18 - 1 # r = 211 c = 31
 
 # abc
 abc <- merge(ab,c, by.ab = Partner, by.c =Partner, all = FALSE, all.x = TRUE, all.y = FALSE)
 dim(abc)
 names(abc)  
 31 + 24 -1 # n = 54
 
 # a_e
 a_e <- merge(abc,de, by.abc = Partner, by.de =Partner, all = FALSE, all.x = TRUE, all.y = FALSE)
 dim(a_e)
 names(a_e) 
 54 + 18 -1 # n = 71
 
 # a_h
 a_h <- merge(a_e,fgh, by.a_e = Partner, by.fgh =Partner, all = FALSE, all.x = TRUE, all.y = FALSE)
 dim(a_h)
 names(a_h) 
 71 + 23 -1 # n = 93
 
 # a_k
 a_k <- merge(a_h,ijk, by.a_h = Partner, by.ijk =Partner, all = FALSE, all.x = TRUE, all.y = FALSE)
 dim(a_k)
 names(a_k) 
 93 + 16 -1 # n = 108
 
 # a_m
 a_m <- merge(a_k,lm, by.a_k = Partner, by.lm =Partner, all = FALSE, all.x = TRUE, all.y = FALSE)
 dim(a_m)
 names(a_m) 
 108 + 26 - 1  # n = 133
 
 # a_p
 a_p <- merge(a_m,nop, by.a_m = Partner, by.nop =Partner, all = FALSE, all.x = TRUE, all.y = FALSE)
 dim(a_p)
 names(a_p) 
 133 + 20 - 1 # n = 152
 
 # a_r
 a_r <- merge(a_p,qr, by.a_p = Partner, by.qr =Partner, all = FALSE, all.x = TRUE, all.y = FALSE)
 dim(a_r)
 names(a_r) 
 152 + 6 -1 # n = 157
 
 # a_s
 a_s <- merge(a_r,s, by.a_r = Partner, by.s =Partner, all = FALSE, all.x = TRUE, all.y = FALSE)
 dim(a_s)
 names(a_s)  
 157 + 27 - 1 # n = 183
 
 # a_v
 a_v <- merge(a_s,tuv, by.a_s = Partner, by.tuv =Partner, all = FALSE, all.x = TRUE, all.y = FALSE)
 dim(a_v)
 names(a_v) 
 183 + 21 - 1 # n = 203
 
 # a_z  (complete data set after this merge)
 a_z <- merge(a_v,wxyz, by.a_v = Partner, by.wxyz =Partner, all = FALSE, all.x = TRUE, all.y = FALSE)
 dim(a_z) # n = 211
 names(a_z)  
Created by Pretty R at inside-R.org

Friday, January 21, 2011

Flexibility of R Graphics

(note scroll all the way down to see 'old code' and 'new more flexible code'

Recall and older post that presented overlapping density plots using R (Visualizing Agricultural Subsidies by KY County) see image below.


The code I used to produce this plot makes use of the rbind and data.frame functions (see below)

library(colorspace) # package for rainbow_hcl function
 
 
ds <- rbind(data.frame(dat=KyCropsAndSubsidies[,][,"LogAcres"], grp="All"),
            data.frame(dat=KyCropsAndSubsidies[,][KyCropsAndSubsidies$subsidy_in_millions > 2.76,"LogAcres"], grp=">median"),
            data.frame(dat=KyCropsAndSubsidies[,][KyCropsAndSubsidies$subsidy_in_millions <= 2.76,"LogAcres"], grp="<=median"))
 
 
# histogram and density for all ears
hs <- hist(ds[ds$grp=="All",1], main="", xlab="LogAcres", col="grey90", ylim=c(0, 25), breaks="fd", border=TRUE)
 
dens <- density(ds[ds$grp=="All",1], na.rm=TRUE)
rs <- max(hs$counts)/max(dens$y)
lines(dens$x, dens$y*rs, type="l", col=rainbow_hcl(3)[1])
 
# density for above median subsidies
dens <- density(ds[ds$grp==">median",1], na.rm=TRUE)
rs <- max(hs$counts)/max(dens$y)
lines(dens$x, dens$y*rs, type="l", col=rainbow_hcl(3)[2])
 
# density for below median subsidies
dens <- density(ds[ds$grp=="<=median",1], na.rm=TRUE)
rs <- max(hs$counts)/max(dens$y)
lines(dens$x, dens$y*rs, type="l", col=rainbow_hcl(3)[3])
 
# Add a rug to illustrate density.
 
rug(ds[ds$grp==">median", 1], col=rainbow_hcl(3)[2])
rug(ds[ds$grp=="<=median", 1], col=rainbow_hcl(3)[3])
 
# Add a legend to the plot.
 
legend("topright", c("All", ">median", "<=media"), bty="n", fill=rainbow_hcl(3))
 
# Add a title to the plot. 
 
title(main="Distribution of Acres Planted by Subsidies Recieved Above or Below Median", sub=paste("Created Using R Statistical Package"))
Created by Pretty R at inside-R.org

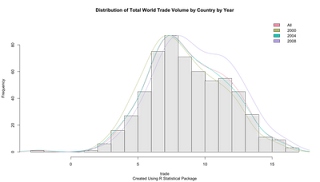
I really don't understand the ins and outs of the rbind or data.frame functions, and in another project, when I tried to repeat a similar analysis, it wouldn't work. I could not figure out what my error was, but I new enough about R to create the plots with an alternative implementation. It is not as compact, but more general, and it worked. (see code below, although it references a new data set with new vars and produces 4 density curves vs. 3)

# histogram and density estimates for all data 
hs <- hist(trade_by_yr$logTrade,main="", xlab="trade", col="grey90", ylim=c(0, 95), breaks="fd", border=TRUE)  # histogram 
 
dens <- density(trade_by_yr$logTrade)  # density 
rs <- max(hs$counts)/max(dens$y)  # rescale/mormalize density 
lines(dens$x, dens$y*rs, type="l", col=rainbow_hcl(4)[1]) # plot densiy 
 
# density estimates for year 2000 trade data
 
y2000 <- trade_by_yr[trade_by_yr$year==2000,] # subset data for year
dens <- density(y2000$logTrade)  # density 
rs <- max(hs$counts)/max(dens$y)  # rescale/mormalize density  
lines(dens$x, dens$y*rs, type="l", col=rainbow_hcl(4)[2]) # plot densiy 
 
# density estimates for year 2004 trade data
 
y2004 <- trade_by_yr[trade_by_yr$year==2004,]  # subset data for year 
dens <- density(y2004$logTrade)  # density 
rs <- max(hs$counts)/max(dens$y)  # rescale/mormalize density 
lines(dens$x, dens$y*rs, type="l", col=rainbow_hcl(4)[3]) # plot densiy 
 
# densty estimates for year 2008 trade data
 
y2008 <- trade_by_yr[trade_by_yr$year==2008,] # subset data for year
dens <- density(y2008$logTrade) # density 
rs <- max(hs$counts)/max(dens$y)  # rescale/mormalize density  
lines(dens$x, dens$y*rs, type="l", col=rainbow_hcl(4)[4]) # plot densiy 
 
# Add a legend to the plot.
 
legend("topright", c("All", "2000", "2004", "2008"), bty="n", fill=rainbow_hcl(4))
 
# Add a title to the plot. 
 
title(main="Distribution of Total World Trade Volume by Country by Year", sub=paste("Created Using R Statistical Package"))
Created by Pretty R at inside-R.org

See graph below: