Showing posts with label causal inference. Show all posts

Thursday, March 2, 2023

Are Matching Estimators and the Conditional Independence Assumption Inconsistent with Rational Decision Making

 Scott Cunningham brings up some interesting points about matching and utility maximization in this substack post: https://causalinf.substack.com/p/why-do-economists-so-dislike-conditional 

"Because most of the time, when you are fully committed to the notion that people are rational, or at least intentionally pursuing goals and living in the reality of scarcity itself, you actually think they are paying attention to those potential outcomes. Why? Because those potential outcomes represent the gains from the choice you’re making....if you think people make choices because they hope the choice will improve their life, then you believe their choices are directly dependent on Y0 and Y1. This is called “selection on treatment gains”, and it’s a tragic problem that if true almost certainly means covariate adjustment won’t work....Put differently, conditional independence essentially says that for a group of people with the same covariate values, their decision making had become erratic and random. In other words, the covariates contained the rationality and you had found the covariates that sucked that rationality out of their minds."

This makes me want to ask - is there a way I can specify utility functions or think about utility maximization that is consistent with the CIA in a matching scenario? This gets me into very dangerous territory because my background is applied economics, not theory. I think most of the time when matching is being used in observational settings, people aren't thinking about utility functions and consumer preferences and how they relate to potential outcomes. Especially non-economists. 

Thinking About Random Utility Models

The discussion above for some reason motivated me to think about random utility models (RUMs). Not being a theory person and not having worked with RUMs hardly at all, I'm being even more dangerous but hear me out, this is just a thought experiment. 

I first heard of RUMs years ago when working in market research and building models focused on student enrollment decisions. From what I understand they are an important work horse in discrete choice modeling applications. Food economist Jayson Lusk has even looked at RUMs and their predictive validity via functional magnetic resonance imaging (see Neural Antecedents of a Random Utility Model).

The equation below represents the basic components of a random utility model:

U = V + e

where V = systemic utility and 'e' represents random utility. 

Consumers choose the option that provides the greatest utility. The systemic component 'V' captures attributes describing the alternative choices or perceptions about the choices, and characteristics of the decision maker.  In the cases where matching methods are used in observational settings, the relevant choice is often whether or not to participate in a program or take treatment.

This seems to speak to one of the challenges raised in Scott's post (keep in mind Scott never mentions RUMS, all this about RUMS are my meandering so if a discussion about RUMs is non-sensical its on me not him): 

"The known part requires a model, be it formal or informal in nature, and the quantified means it’s measured and in your dataset. So if you have the known and quantified confounder, then a whole host of solutions avail themselves to you like regression, matching, propensity scores, etc....There’s a group of economists who object to this statement, and usually it’s that “known” part."

What seems appealing to me is that RUMs appear to allow us to make use of what we think we can know about utility via 'V' and still admit that there is a lot we don't know, captured by 'e' in a random utility model. In this formulation 'e' still represents rationality, it's just unobservable heterogeneity in rational preferences that we can't observe. This is assumed to be random. Many economists working in discrete choice modeling contexts are apparently comfortable with the 'known' part of a RUM at least from the way I understand this.

A Thought Experiment: A Random Utility Model for Treatment Participation

Again - proceeding cautiously here, suppose that in an observational setting the decision to engage in a program or treatment D designed to improve outcome Y is driven by systematic and random components in a RUM:

U = V(x) + e

and the decision to participate is based on as Scott describes the potential outcomes Y1 and Y0 which represent the gains from choosing. 

delta = (Y1 - Y0) where you get Y1 for choosing D=1 and Y0 for D=0

In the RUM you choose D = 1 if U(D = 1) > U(D = 0) 

D = f(delta) = f(Y1,Y0)= f(x)

and we specify the RUM as U(D) = V(x) + e

where x represents all the observable things that might contribute to an individual's utility (perceptions about the choices, and characteristics of the decision maker) in relation to making this decision. 

So the way I wanted to think about this is when we are matching, the factors we match/control for would be the observable variables 'x' that contribute to systemic utility V(x), while many of the unobservable aspects reflect heterogeneous preferences across individuals that we can't observe. This would contribute to the random component of the RUM. 

So in essence YES, if we think about this in the context of a RUM, the covariates contain all of the rationality (at least the observable parts) and what is unobserved can be modeled as random. We've harmonized utility maximization, matching and the CIA! 

Meeting the Assumptions of Random Utility and the CIA

But wait...not so fast. In the observational studies where matching is deployed, I am not sure we can assume the unobserved heterogeneous preferences represented by 'e' will be random across the groups we are comparing.  Those who choose D =1 will have obvious differences in preferences than those who choose D = 0. There will be important differences between treatment and control groups' preferences not accounted for by covariates in the systemic component V(x) and those unobserved preferences in 'e' will be dependent on potential outcomes Y0 and Y1 just like Scott was saying. I don't think we can assume in an observational setting with treatment selection that the random component of the RUM is really random with regard to the choice of taking treatment if the choice is driven by expected potential outcomes. 

Some Final Questions

If 'x' captures everything relevant to an individual's assessment of their potential outcomes Y1 and Y0 (and we have all the data for 'x' which itself is a questionable assumption) then could we claim that everything else captured by the term 'e' is due to random noise - maybe pattern noise or occasion noise? 

In an observational setting where we are modeling treatment choice D, can we break 'e' down further into components like below?

e = e1 + e2

where e1 is unobservable heterogeneity in rational preferences driven by potential outcomes Y1 & Y0 making it non random and e2 represents noise that is more random like pattern or occasion noise and likely to be independent of Y1 & Y0. 

IF the answer to the questions above is YES and we can decompose the random component of RUMS this way and e2 makes up the largest component of e (i.e  e1 is small, non-existent, or insignificant),  then maybe a RUM is a valid way to think about modeling the decision to choose treatment D and we can match on the attributes of systemic utility 'x' and appeal to the CIA (if my understanding is correct).

But the less we actually know about x and what is driving the decision as it relates to potential outcomes Y0 and Y1, the larger e1 becomes and then the random component of a RUM may no longer be random. 

If my understanding above is correct, then the things we likely would have to assume for a RUM to be valid turn out to be similar to if not exactly the things we need for the CIA to hold. 

The possibility of meeting the assumptions of a RUM or the CIA would seem unlikely in observational settings if (1) we don't know a lot about systemic utility and 'x' and (2) the random component  e turns out not to be random. 

Conclusion

So much for an applied guy trying to do theory to support the possibility of the CIA holding in matched analysis.  I should say I am not an evangelist for matching but trying to be more of a realist about its uses and validity.  Scott's post introduces a very interesting way to think about matching and the CIA and the challenges we might have meeting the conditions for it. 


Thursday, January 26, 2023

What is new and different about difference-in-differences?

Back in 2012 I wrote about the basic 2 x 2 difference in difference analysis (two groups, two time periods). Columbia public health probably has a better introduction. 

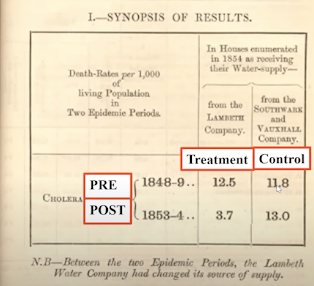
The most famous example of an analysis that motivates a 2 x 2 DID analysis is John Snow's 1855 analysis of the cholera epidemic in London:


(Image Source)

 I have since written about some of the challenges of estimating DID with glm models (see here, here, and here.), as well as combining DID with matching, and problems to watch out for when combining methods. But a lot of what we know about difference in differences has changed in the last decade. I'll try to give a brief summary based on my understanding and point towards some references that do a better job presenting the current state.

The Two-Way Fixed Effects model (TWFE)

The first thing I should discuss is extending the 2x2 model to include multiple treated groups and/or multiple time periods. The generalized model for DiD also referred to as the two-way fixed effects (TWFE) model is the best way to represent those kind of scenarios:.

Ygt = ag + bt + δDgt + εt

ag = group fixed effects

bt = time fixed effects

Dgt= treatment*post period (interaction term)

δ = ATT or DID estimate

Getting the correct standard errors for DID models that involve many repeated measures over time and/or where treatment and control groups are defined by multiple geographies presents two challenges compared to the basic 2x2 model. Serial correlation and correlation within groups. There are several approaches that can be considered depending on your situation.

1 - Block bootstrapping

2 - Aggregating data into single pre and post periods

3 - Clustering standard errors at the group level

Clustering at the group level should provide the appropriate standard errors in these situations when the number of clusters are large.

For more details on TWFE models, both Scott Cunningham and Nick Huntington-Klein have great econometrics textbooks with chapters devoted to these topics. See the references below for more info.

Differential Timing and Staggered Rollouts

But things can get even more complicated with DID designs. Think about situations where there are different groups getting treated at different times over a number of time periods. This is not just a thought experiment trying to imagine the most difficult study design and pondering for the sake of pondering – these kind of staggered rollouts are very common in business and policy settings.  Imagine policy rules adopted by different states over time (like changes in minimum wages) or imagine testing a new product or service by rolling it out to different markets over time. Understanding how to evaluate their impact is important. For a while it seemed economists may have been a little guilty of handwaving with the TWFE model assuming the estimated treatment coefficient was giving them the effect they wanted. 

But Andrew Goodman-Bacon refused to take this interpretation at face value and broke this down for us determining that the TWFE estimator was trying to give us a weighted average of all potential 2x2 DID estimates you could make with the data. That actually sounds intuitive and helpful. But what he discovered that is not so intuitive is that some of those 2x2 comparisons could be comparing previously treated groups with current treated groups. That's not a comparison we generally are interested in making, but it gets averaged in with the others and can drastically bias the results particularly when there is treatment effect heterogeneity (the treatment effect is different across groups and trending over time). 

So how do you get a better DID estimate in this situation? I'll spare you the details (because I'm still wrestling with them) but the answer seems to be the estimation strategy developed by Callaway and Sant'Anna. The documentation in R for their package walks through a lot of the details and challenges with TWFE models with differential timing. 

Additionally this video of Andrew Goodman-Bacon was really helpful for understanding the 'Bacon' decomposition of TWFE models and the problems above.


After watching Goodman-Bacon, I recommend this talk from Sant'Anna discussing their estimator. 

Below Nick Huntington-Klein provides a great summary of the issues made apparent by the Bacon decomposition made above and the Callaway and Sant'Anna method for staggered/rollout DID designs. he also gets into the Wooldridge Mundlack approach:

A Note About Event Studies

In a number of references I have tried to read to understand this issue, the term 'event study' is thrown around and it seems like every time it is used it is used differently but the author/speaker assumes we are all taking about the same thing. In this video Nick Huntington-Klein introduces event studies in a way that is the most clear and consistent. Watching this video might help.

References: 

Causal Inference: The Mixtape. Scott Cunningham. https://mixtape.scunning.com/ 

The Effect: Nick Huntington-Klein. https://theeffectbook.net/

Andrew Goodman-Bacon. Difference-in-differences with variation in treatment timing. Journal of Econometrics.Volume 225, Issue 2, 2021.

Brantly Callaway, Pedro H.C. Sant’Anna. Difference-in-Differences with multiple time periods. Journal of Econometrics. Volume 225, Issue 2, 2021,

Related Posts:

Modeling Claims Costs with Difference in Differences. https://econometricsense.blogspot.com/2019/01/modeling-claims-with-linear-vs-non.html 

Was It Meant to Be? OR Sometimes Playing Match Maker Can Be a Bad Idea: Matching with Difference-in-Differences. https://econometricsense.blogspot.com/2019/02/was-it-meant-to-be-or-sometimes-playing.html 


Saturday, October 29, 2022

The Value of Experimentation and Causal Inference in Complex Business Environments

Introduction


Summary: Causality in business means understanding how to connect the things we do with the value we create. A cause is something that makes a difference (Dave Lewis, Journal of Philosophy, 1973). If we are interested in what makes a difference in creating business value (what makes a difference in moving the truck above), we care about causality. Causal inference in business helps us create value by providing knowledge about what makes a difference so we can move resources from a lower valued use (having folks on the back of the truck) to a higher valued use (putting folks behind the truck). 


We might hear the phrase correlation is not causation so often that it could easily be dismissed as a cliche, as opposed to a powerful mantra for improving knowledge and decision making. These distinctions have an important meaning in business and applied settings. We could think of businesses as collections of decisions and processes that move and transform resources. Business value is created by moving resources from lower to higher valued uses.  Knowledge is the most important resource in a firm and the essence of organizational capability, innovation, value creation, and competitive advantage. Causal knowledge is no exception. Part 1 of this series discusses the knowledge problem and decisions.

In business talk can be cheap. With lots of data anyone can tell a story to support any decision they want to make. But good decision science requires more than just having data and a good story, it's about having evidence to support decisions so we can learn faster and fail smarter.  In the diagram above this means being able to identify a resource allocation that helps us push the truck forward (getting people behind the truck). Confusing correlation with causation might lead us to believe value is a matter of changing shirt colors vs. moving people. We don't want to be weeks, months, or years down the road only to realize that other things are driving outcomes, not the thing we've been investing in. By that time, our competition is too far ahead for us to ever to catch up and it may be too late for us to make up for the losses of misspent resources. This is why in business, we want to invest in causes, not correlations. We are ultimately going to learn either way, the question is about if we'd rather do it faster and methodically, or slower and precariously. 

How does this work? You might look at the diagram above and tell yourself - it's common sense where you need to stand to push the truck to move it forward - I don't need any complicated analysis or complex theories to tell me that. That's true for a simple scenario like that and likely so for many day to day operational decisions. Sometimes common sense or subject matter expertise can provide us with sufficient causal knowledge to know what actions to take. But when it comes to informing the tactical implementation of strategy (discussed in part 3 of this series) we can't always make that assumption. In complex business environments with high causal density (where the number of things influencing outcomes is numerous), we usually don't know enough about the nature and causes of human behavior, decisions, and causal paths from actions to outcomes to account for them well enough to know - what should I do?  What creates value? In complicated business environments intuition alone may not be enough - as I discuss in part 2 of this series we can be easily fooled by our own biases and biases in the data and the many stories that it could tell. 

From his experience with Microsoft, Ron Kohavi shares, up to 2/3 of the ideas we might test in a business environment turn out to either have flat results or harm the metric we are trying to improve. In Noise: A Flaw in Human Judgement authors share how often experts disagree with each other and even themselves at different times because of biases in judgement and decision making. As Stephen Wendel says you can't just wing it with bar charts and graphs when you need to know what makes a difference. 

In application, experimentation and casual inference represents a way of thinking that requires careful consideration of the business problem and all the ways that our data can fool us; separating signal from noise (statistical inference) and making the connection between actions and outcomes (causal inference). Experimentation and causal inference leverages good decision science that brings together theory and subject matter expertise with data so we can make better informed business decisions in the face of our own biases and the biases in data. In the series of posts that follow, I overview in more detail the ways that experimentation and causal inference help us do these things in complex business environments. 

The Value of Experimentation and Causal Inference in Complex Business Environments:

Part 1: The Knowledge Problem

Part 2: Behavioral Biases

Part 3: Strategy and Tactics


Thursday, November 4, 2021

Causal Decision Making with non-Causal Models

In a previous post I noted: 

" ...correlations or 'flags' from big data might not 'identify' causal effects, but they are useful for prediction and might point us in directions where we can more rigorously investigate causal relationships"

Recently on LinkedIn I discussed situations where we have to be careful about taking action on specific features in a correlational model, for instance changing product attributes or designing an intervention based on interpretations of SHAP values from non-causal predictive models. I quoted Scott Lundberg:

"regularized machine learning models like XGBoost will tend to build the most parsimonious models that predict the best with the fewest features necessary (which is often something we strive for). This property often leads them to select features that are surrogates for multiple causal drivers which is "very useful for generating robust predictions...but not good for understanding which features we should manipulate to increase retention."

So sometimes, we may go into a project with the intention of only needing predictions. We might just want to target offers or nudges to customers or product users but not think about this in causal terms at first. But, as I have discussed before the conversation often inevitably turns to causality, even if stakeholders and business users don't use causal language to describe their problems. 

"Once armed with predictions, businesses will start to ask questions about 'why'... they will want to know what decisions or factors are moving the needle on revenue or customer satisfaction and engagement or improved efficiencies...There is a significant difference between understanding what drivers correlate with or 'predict' the outcome of interest and what is actually driving the outcome."

This would seem to call for causal models. However, in their recent paper Carlos Fernández-Loría and Foster Provost make an exciting claim:

“what might traditionally be considered “good” estimates of causal effects are not necessary to make good causal decisions…implications above are quite important in practice, because acquiring data to estimate causal effects accurately is often complicated and expensive. Empirically, we see that results can be considerably better when modeling intervention decisions rather than causal effects.”

Now in this case they are not talking about causal models related to identifying key drivers of an outcome, so it is not contradicting anything mentioned above or in previous posts. Particularly they are talking about building models for causal decision making (CDM) that are simply focused on making decisions about who to 'treat' or target.  In this particular scenario businesses are leveraging predictive models to target offers, provide incentives, or make recommendations. As discussed in the paper, there are two broad ways of approaching this problem. Let's say the problem is related to churn.

1) We could predict risk of churn and target members most likely to churn. We could do this with a purely correlational machine learning model. The output or estimand from this model is a predicted probability p() or risk score. They also refer to these kinds of models as 'outcome' models

2) We could build a causal model, that predicts causal impact of an outreach. This would allow us to target customers that we can most likely 'save' as a result of our intervention. They refer to this estimand as a causal effect estimate CEE. Building machine learning models that are causal can be more challenging and resource intensive.

It is true at the end of the day we want to maximize our impact. But the causal decision is ultimately who do we target in order to maximize impact. They point out this causal decision does not necessarily hinge on how accurate our point estimate is related to causal impact as long as errors in prediction still lead to the same decisions about who to target.

What they find is that in order to make good causal decisions about who to 'treat' we don't have to have super accurate estimates of the causal impact of treatment (or models focused on CEE). In fact they talk through scenarios and conditions where outcome models like #1 above that are non-causal, can perform just as well or sometimes better than more accurate causal models focusing on CEE. 

In other words, correlational outcome models (like #1) can essentially serve as proxies for the more complicated causal models (like #2), even if the data used to estimate these 'proxy' models is confounded.

 Scenarios where this is most likely include:

1) Outcomes used as proxies and (causal)effects are correlated

2) Outcomes used as proxies are easier to estimate than causal effects

3) Predictions are used to rank individuals

They also give some reasons why this may be true. Biased non-causal models built on confounded data may not be able to identify true causal effects, but still be useful for identifying the optimal decision. 

"This could occur when confounding is stronger for individuals with large effects - for example if confounding bias is stronger for 'likely' buyers, but the effect of adds is also stronger for them...the key insight here is that optimizing to make the correct decision generally involves understanding whether a causal effect is above or below a given threshold, which is different from optimizing to reduce the magnitude of bias in a causal effect estimate."

"Models trained with confounded data may lead to decisions that are as good (or better) than the decisions made with models trained with costly experimental data, in particular when larger causal effects are more likely to be overestimated or when variance reduction benefits of more and cheaper data outweigh the detrimental effect of confounding....issues that make it impossible to estimate causal effects accurately do not necessarily keep us from using the data to make accurate intervention decisions."

Their arguments hinge on the idea that what we are really solving for in these decisions is based on ranking:

"Assuming...the selection mechanism producing the confounding is a function of the causal effect - so that the larger the causal effect the stronger the selection-then (intuitively) the ranking of the preferred treatment alternatives should be preserved in the confounded setting, allowing for optimal treatment assignment policies from data."

A lot of this really comes down to proper problem framing and appealing to the popular paraphrasing of George E. P. Box - all models are wrong, but some are useful. It turns out in this particular use case non-causal models can be as useful or more useful than causal ones.

And we do need to be careful about the nuance of the problem framing. As the authors point out, this solves one particular business problem and use case, but does not answer some of the most important causal questions businesses may be interested in:

"This does not imply that firms should stop investing in randomized experiments or that causal effect estimation is not relevant for decision making. The argument here is that causal effect estimation is not necessary for doing effective treatment assignment."

They go on to argue that randomized tests and other causal methods are still core to understanding the effectiveness of interventions and strategies for improving effectiveness. Their use case begins and ends with what is just one step in the entire lifecycle of product development, deployment, and optimization. In their discussion of further work they suggest that:

"Decision makers could focus on running randomized experiments in parts of the feature space where confounding is particularly hurtful for decision making, resulting in higher returns on their experimentation budget."

This essentially parallels my previous discussion related to SHAP values. For a great reference for making practical business decisions about when this is worth the effort see the HBR article in the references discussing when to act on a correlation.

So some big takeaways are:

1) When building a model for purposes of causal decision making (CDM) even a biased model (non-causal) can perform as well or better than a causal model focused on CEE.

2) In many cases, even a predictive model that provides predicted probabilities or risk (as proxies for causal impact or CEE) can perform as well or better than causal models when the goal is CDM.

3) If the goal is to take action based on important features (i.e. SHAP values as discussed before) however, we still need to apply a causal framework and understanding the actual effectiveness of interventions may still require randomized tests or other methods of causal inference.


References: 

Causal Decision Making and Causal Effect Estimation Are Not the Same... and Why It Matters. Carlos Fernández-Loría and Foster Provost. 2021. https://arxiv.org/abs/2104.04103

When to Act on a Correlation, and When Not To. David Ritter. Harvard Business Review. March 19, 2014. 

Be Careful When Interpreting Predictive Models in Search of Causal Insights. Scott Lundberg. https://towardsdatascience.com/be-careful-when-interpreting-predictive-models-in-search-of-causal-insights-e68626e664b6  

Additional Reading:

Laura B Balzer, Maya L Petersen, Invited Commentary: Machine Learning in Causal Inference—How Do I Love Thee? Let Me Count the Ways, American Journal of Epidemiology, Volume 190, Issue 8, August 2021, Pages 1483–1487, https://doi.org/10.1093/aje/kwab048

Petersen, M. L., & van der Laan, M. J. (2014). Causal models and learning from data: integrating causal modeling and statistical estimation. Epidemiology (Cambridge, Mass.), 25(3), 418–426. https://doi.org/10.1097/EDE.0000000000000078

Explaining the Behavior of Black-Box Prediction Algorithms with Causal Learning. Numair Sani, Daniel Malinsky, Ilya Shpitser arXiv:2006.02482v3  

Related Posts:

Will there be a credibility revolution in data science and AI? 

Statistics is a Way of Thinking, Not a Toolbox

Big Data: Don't Throw the Baby Out with the Bathwater

Big Data: Causality and Local Expertise Are Key in Agronomic Applications 

The Use of Knowledge in a Big Data Society

Wednesday, July 7, 2021

R.A Fisher, Big Data, and Pretended Knowledge

In Thinking Fast and Slow, Kahneman points out that what matters more than the quality of evidence, is the coherence of the story. In business and medicine, he notes that this kind of 'pretended' knowledge  based on coherence is often sought and preferred. We all know that no matter how great the analysis, if we can't explain and communicate the results with influence, our findings may go unappreciated.  But as we have learned from misinformation and disinformation about everything from vaccines to GMOs, Kahneman's insight is a double edge sword that cuts both ways. Coherent stories often win out over solid evidence and lead to making the wrong decision. We see this not only in science and politics, but also in business. 

In the book The Lady Tasting Tea by David Salsburg, we learn that R.A. Fisher was all too familiar with the pitfalls of attempting to innovate based on pretended knowledge and big data (excerpts):

"The Rothamsted Agricultural Experiment Station, where Fisher worked during the early years of the 20th century, had been experimenting with different fertilizer components for almost 90 years before he arrived...for 90 years the station ran experiments testing different combinations of mineral salts and different strains of wheat, rye, barley, and potatoes. This had created a huge storehouse of data, exact daily records of rainfall and temperature, weekly records of fertilizer dressings and measures of soil, and annual records of harvests - all of it preserved in leather bound notebooks. Most of the 'experiments' had not produced consistent results, but the notebooks had been carefully stored away in the stations archives....the result of these 90 years of 'experimentation' was a mess of confusion and vast troves of unpublished and useless data...the most that could be said of these [experiments] was that some of them worked sometimes, perhaps, or maybe."

Fisher introduced the world to experimental design and challenged the idea that scientists could make progress by tinkering alone. Instead, he motivated them to think through inferential questions- Is the difference in yield for variety A vs variety B (signal) due to superior genetics, or is this difference what we would expect to see anyway due to natural variation in crop yields (noise) i.e. in other words is the differences in yield statistically significant? This is the original intention of the concept of statistical significance that has gotten lost in the many abuses and misinterpretations often hear about. He also taught us to ask questions about causality, does variety A actually yield better than variety B because it is genetically superior, or could differences in yield be explained by differences in soil characteristics, weather/rainfall, planting date, or numerous other factors. His methods taught us how to separate the impact of a product or innovation from the impact and influences of other factors.

Fisher did more than provide a set of tools for problem solving. He introduced a structured way of thinking about real world problems and the data we have to solve them.  This way of thinking moved the agronomists at Rothamsted away from from mere observation to useful information. This applies not only to agriculture, but to all of the applied and social sciences as well as business.

In his book Uncontrolled, Jim Manzi stressed the importance of thinking like Fisher's plant breeders and agronomists (Fisher himself was a geneticist) especially in business settings. Manzi describes the concept of 'high causal density' which is the idea that often the number of causes of variation in outcomes can be enormous with each having the potential to wash out the cause we are most interested in (whatever treatment or intervention we are studying). In business, which is a social science, this becomes more challenging than in the physical and life sciences. In physics and biology we can assume relatively uniform physical and biological laws that hold across space and time. But in business the 'long chain of causation between action and outcome' is 'highly dependent for its effects on the social context in which it is executed.' It's all another way of saying that what happens in the outside world can often have a much larger impact on our outcome than a specific business decision, product, or intervention. As a result this calls for the same approach Fisher advocated in agriculture to be applied in business settings. 

List and Gneezy address this in The Why Axis:

"Many businesses experiment and often...businesses always tinker...and try new things...the problem is that businesses rarely conduct experiments that allow a comparison between a treatment and control group...Business experiments are research investigations that give companies the opportunity to get fast and accurate data regarding important decisions."

Fisher's approach soon caught on and revolutionized science and medicine, but in many cases is still lagging adoption in some business settings in the wake of big data, AI, and advances in machine learning. As Jim Manzi and Stefan Thomke state in Harvard Business Review in the absence of formal randomized testing and good experimental design:

"executives end up misinterpreting statistical noise as causation—and end up making bad decisions"

In The Book of Why, Judea Pearl laments the reluctance to embrace causality: 

"statistics, including many disciplines that looked to it for guidance remained in the prohibition era, falsely believing that the answers to all scientific questions reside in the data, to be unveiled through clever data mining tricks...much of this data centric history still haunts us today. We live in an era that presumes Big Data to be the solution to all of our problems. Courses in data science are proliferating in our universities, and jobs for data scientists are lucrative in companies that participate in the data economy. But I hope with this book to convince you that data are profoundly dumb...over and over again, in science and business we see situations where more data aren't enough. Most big data enthusiasts, while somewhat aware of those limitations, continue to chase after data centric intelligence."

These big data enthusiasts strike a strong resemblance to the researchers at Rothamsted before Fisher. List has a similar take:

"Big data is important, but it also suffers from big problems. The underlying approach relies heavily on correlations, not causality. As David Brooks has noted, 'A zillion things can correlate with each other depending on how you structure of the data and what you compare....because our work focuses on field experiments to infer causal relationships, and because we think hard about these causal relationships of interest before generating the data we go well beyond what big data could ever deliver."

We often want fast iterations and actionable insights from data. While it is true, a great analysis with no story delivered too late is as good as no analysis, it is just as true that quick insights with a coherent story based on pretended knowledge from big data can leave you running in circles getting nowhere - no matter how fast you might feel like you are running. In the case of Rothamsted, scientists ran in circles for 90 years before real insights could be uncovered using Fisher's more careful and thoughtful analysis. Even if they had today's modern tools of AI and ML and data visualization tools to cut the data 1000 different ways they still would not have been able to get any value for all of their effort. Wow, 90 years! How is that for time to insight? In many ways, despite drowning in data and the advances in AI and machine learning, many areas of business across a number of industries will find themselves in the same place Fisher found himself at Rothamsted almost 100 years ago. We will need a credibility revolution in AI to bring about the kind of culture change that will make the kind of causal and inferential thinking that comes natural to today's agronomists (thanks to Fisher) or more recently the way Pearl's disciples think about causal graphs more commonplace in business strategy. 

Notes: 

1) Randomized tests are not always the only way to make causal inferences. In fact in the Book of Why Pearl notes in relation to smoking and lung cancer, outside of the context of randomized controlled trials "millions of lives were lost or shortened because scientists did not have adequate language or methodology for answering causal questions." The credibility revolution in epidemiology and economics, along with Pearl's work has provided us with this language. As Pearl notes: "Nowadays, thanks to carefully crafted causal models, contemporary scientists can address problems that would have once been considered unsolvable or beyond the pale of scientific inquiry." See also: The Credibility Revolution(s) in Econometrics and Epidemiology.

2) Deaton and Cartwright make strong arguments challenging the supremacy of randomized tests as the gold standard for causality (similar to Pearl) but this only furthers the importance of considering careful causal questions in business and science by broadening the toolset along the same lines as Pearl. Deaton and Cartwright also emphasize the importance of interpreting causal evidence in the context of sound theory. See: Angus Deaton, Nancy Cartwright,Understanding and misunderstanding randomized controlled trials,Social Science & Medicine, Volume 210, 2018.

3) None of this is to say that predictive modeling and machine learning cannot answer questions and solve problems that create great value to business. The explosion of the field of data science is an obvious testament to this fact. Probably the most important thing in this regard is for data scientists and data science managers to become familiar with the important distinctions between models and approaches that explain or predict. See also: To Explain or Predict and Big Data: Don't Throw the Baby Out with the Bathwater

Additional Reading

Will there be a credibility revolution in data science and AI? 

https://econometricsense.blogspot.com/2018/03/will-there-be-credibility-revolution-in.html 

Statistics is a Way of Thinking, Not a Toolbox

https://econometricsense.blogspot.com/2020/04/statistics-is-way-of-thinking-not-just.html 

The Value of Business Experiments and the Knowledge Problem

https://econometricsense.blogspot.com/2020/04/the-value-of-business-experiments-and.html

The Value of Business Experiments Part 2: A Behavioral Economic Perspective

http://econometricsense.blogspot.com/2020/04/the-value-of-business-experiments-part.html 

The Value of Business Experiments Part 3: Innovation, Strategy, and Alignment 

http://econometricsense.blogspot.com/2020/05/the-value-of-business-experiments-part.html 

Big Data: Don't Throw the Baby Out with the Bathwater

http://econometricsense.blogspot.com/2014/05/big-data-dont-throw-baby-out-with.html 

Big Data: Causality and Local Expertise Are Key in Agronomic Applications

http://econometricsense.blogspot.com/2014/05/big-data-think-global-act-local-when-it.html

The Use of Knowledge in a Big Data Society

https://www.linkedin.com/pulse/use-knowledge-big-data-society-matt-bogard/ 


Wednesday, September 2, 2020

Blocking and Causality

In a previous post I discussed block randomized designs. 

Duflo et al (2008) describe this in more detail:

"Since the covariates to be used must be chosen in advance in order to avoid specification searching and data mining, they can be used to stratify (or block) the sample in order to improve the precision of estimates. This technique (¯rst proposed by Fisher (1926)) involves dividing the sample into groups sharing the same or similar values of certain observable characteristics. The randomization ensures that treatment and control groups will be similar in expectation. But stratification is used to ensure that along important observable dimensions this is also true in practice in the sample....blocking is more efficient than controlling ex post for these variables, since it ensures an equal proportion of treated and untreated unit within each block and therefore minimizes variance."

They also elaborate on blocking when you are interested in subgroup analysis:

"Apart from reducing variance, an important reason to adopt a stratified design is when the researchers are interested in the effect of the program on specific subgroups. If one is interested in the effect of the program on a sub-group, the experiment must have enough power for this subgroup (each sub-group constitutes in some sense a distinct experiment). Stratification according to those subgroups then ensure that the ratio between treatment and control units is determined by the experimenter in each sub-group, and can therefore be chosen optimally. It is also an assurance for the reader that the sub-group analysis was planned in advance."

Dijkman et al (2009) discuss subgroup analysis in blocked or stratified designs in more detail:

"When stratification of randomization is based on subgroup variables, it is more likely that treatment assignments within subgroups are balanced, making each subgroup a small trial. Because randomization makes it likely for the subgroups to be similar in all aspects except treatment, valid inferences about treatment efficacy within subgroups are likely to be drawn. In post hoc subgroup analyses, the subgroups are often incomparable because no stratified randomization is performed. Additionally, stratified randomization is desirable since it forces researchers to define subgroups before the start of the study."

Both of these accounts seem very much consistent with each other in terms of thinking about randomization within subgroups creating a mini trial where causal inferences can be drawn. But I think the key thing to consider is they are referring to comparisons made WITHIN sub groups and not necessarily BETWEEN subgroups. 

Gerber and Green discuss this in one of their chapters on analysis of block randomized experiments :

"Regardless of whether one controls for blocks using weighted regression or regression with indicators for blocks, they key principle is to compare treatment and control subjects within blocks, not between blocks."

When we start to compare treatment and control units BETWEEN blocks or subgroups we are essentially interpreting covariates and this cannot be done with a causal interpretation. Green and Gerber discuss an example related to differences in the performance of Hindu vs. Muslim schools. 

"it could just be that religion is a marker for a host of unmeasured attributes that are correlated with educational outcomes. The set of covariates included in an experimental analysis need not be a complete list of factors that affect outcomes: the fact that some factors are left out or poorly measured is not a source of bias when the aim is to measure the average treatment effect of the random intervention. Omitted variables and mismeasurement, however, can lead to sever bias if the aim is to draw causal inferences about the effects of covariates. Causal interpretation of the covariates encounters all of the threats to inference associated with analysis of observational data."

In other words, these kinds of comparisons face the the same challenges related to interpreting control variables in a regression in an observational setting (see Keele, 2020). 

But why doesn't randomization within religion allow us to make causal statements about these comparisons? Let's think about a different example. Suppose we wanted to measure treatment effects for some kind of educational intervention and we were interested in subgroup differences in the outcome between public and private high schools. We could randomly assign treatments and controls within the public school population and do the same within the private school population. We know overall treatment effects would be unbiased because the school type would be perfectly balanced (instead of balanced just on average in a completely random design) and we would expect all other important confounders to be balanced between treatments and controls on average. 


We also know that within the group of private schools the treatment and controls should at least on average be balanced for certain confounders (median household income, teacher's education/training/experience, and perhaps an unobservable confounder related to student motivation). 

We could say the same thing about comparisons WITHIN the subgroup of public schools. But there is no reason to believe that the treated students in private schools would be comparable to the treated students in public schools because there is no reason to expect that important confounders would be balanced when making the comparisons. 

Assume we are looking at differences in first semester college GPA. Maybe within the private subgroup we find that treated treated students on average have a first semester college GPA that is .25 points higher the comparable control group. But within the public school subgroup, this differences was only .10. We can say that there is a difference in outcomes of .15 points between groups but can we say this is causal? Is the difference really related to school type or is school type really a proxy for income, teacher quality, or motivation? If we increased motivation or income in the public schools would that make up the difference? We might do better if our design originally stratified on all of these important confounders like income and teacher education. Then we could compare students in both public and private schools with similar family incomes and teachers of similar credentials. But...there is no reason to believe that student motivation would be balanced. We can't block or stratify on an unobservable confounder. Again, as Gerber and Green state, we find ourselves in a world that borders between experimental and non-experimental methods. Simply, the subgroups defined by any particular covariate that itself is not or cannot be randomly assigned may have different potential outcomes. What we can say from these results is that school type predicts the outcome but does not necessarily cause it.

Gerber and Green expound on this idea:

"Subgroup analysis should be thought of as exploratory or descriptive analysis....if the aim is simply to predict when treatment effects will be large, the researcher need not have a correctly specified causal model that explains treatment effects (see to explain or predict)....noticing that treatment effects tend to be large in some groups and absent from others can provide important clues about why treatments work. But resist the temptation to think subgroup differences establish the causal effect of randomly varying one's subgroup attributes."

References

Dijkman B, Kooistra B, Bhandari M; Evidence-Based Surgery Working Group. How to work with a subgroup analysis. Can J Surg. 2009;52(6):515-522. 

Duflo, Esther, Rachel Glennerster, and Michael Kremer. 2008. “Using Randomization in Development Economics Research: A Toolkit.” T. Schultz and John Strauss, eds., Handbook of Development Economics. Vol. 4. Amsterdam and New York: North Holland.

Gerber, Alan S., and Donald P. Green. 2012. Field Experiments: Design, Analysis, and Interpretation. New York: W.W. Norton

Keele, L., Stevenson, R., & Elwert, F. (2020). The causal interpretation of estimated associations in regression models. Political Science Research and Methods, 8(1), 1-13. doi:10.1017/psrm.2019.31

Sunday, July 26, 2020

Assessing Balance for Matching and RCTs

Assessing the balance between treatment and control groups across control variables is an important part of propensity score matching. It's heuristically an attempt to ‘recreate’ a situation similar to a randomized experiment where all subjects are essentially the same except for the treatment (Thoemmes and Kim, 2011). Matching itself should not be viewed so much as an estimation technique, but a pre-processing step to ensure that members assigned to treatment and control groups have similar covariate distributions 'on average' (Ho et al., 2007)

This understanding of matching often gets lost among practitioners and it is evident in attempts to use statistical significance testing (like t-tests) to assess baseline differences in covariates between treatment and control groups . This is often done as a means to (1) determine which variables to match on and (2) determine if appropriate balance has been achieved after matching.

Stuart (2010) discusses this:

"Although common, hypothesis tests and p-values that incorporate information on the sample size (e.g., t-tests) should not be used as measures of balance, for two main reasons (Austin, 2007; Imai et al., 2008). First, balance is inherently an in-sample property, without reference to any broader population or super-population. Second, hypothesis tests can be misleading as measures of balance, because they often conflate changes in balance with changes in statistical power. Imai et al. (2008) show an example where randomly discarding control individuals seemingly leads to increased balance, simply because of the reduced power."

Imai et al. (2008) elaborate. Using simulation they demonstrate that:

"The t-test can indicate that balance is becoming better whereas the actual balance is growing worse, staying the same or improving. Although we choose the most commonly used t-test for illustration, the same problem applies to many other test statistics that are used in applied research. For example, the same simulation applied to the Kolmogorov–Smirnov test shows that its p-value monotonically increases as we randomly drop more control units. This is because a smaller sample size typically produces less statistical power and hence a larger p-value"

and

"from a theoretical perspective, balance is a characteristic of the sample, not some hypothetical population, and so, strictly speaking, hypothesis tests are irrelevant in this context"

Austin (2009) has a paper devoted completely to balance diagnostics for propensity score matching (absolute standardized differences are recommended as an alternative to using significance tests).

OK so based on this view of matching as a data pre-processing step in an observational setting, using hypothesis tests and p-values to assess balance may not make sense. But what about randomized controlled trials and randomized field trials? In those cases randomization is used as a means to achieve balance outright instead of matching after the fact in an observational setting. Even better, we hope to achieve balance on unobservable confounders that we could never measure or match on. But sometimes randomization isn't perfect in this regard, especially in smaller samples. So we still may want to investigate treatment and control covariate balance in this setting in order to (1) identify potential issues with randomization (2) statistically control for any chance imbalances.

Altman (1985) discusses the implication of using significance tests to assess balance in randomized clinical trials:

"Randomised allocation in a clinical trial does not guarantee that the treatment groups are comparable with respect to baseline characteristics. It is common for differences between treatment groups to be assessed by significance tests but such tests only assess the correctness of the randomisation, not whether any observed imbalances between the groups might have affected the results of the trial. In particular, it is quite unjustified to conclude that variables that are not significantly differently distributed between groups cannot have affected the results of the trial."

"The possible effect of imbalance in a prognostic factor is considered, and it is shown that non‐significant imbalances can exert a strong influence on the observed result of the trial, even when the risk associated with the factor is not all that great."

Even though this was in the context of an RCT and not an observational study, this seems to parallel the simulation results from Imai et al. (2008). Altman seems indignant about the practice:

"Putting these two ideas together, performing a significance test to compare baseline variables is to assess the probability of something having occurred by chance when we know that it did occur by chance. Such a
procedure is clearly absurd."

More recent discussions include Egbewale (2015) and also Pocock et al. (2002) who found that nearly 50% of practitioners were still employing significance testing to assess covariate balance in randomized trials.

So if using significance tests for balance assessment in matched and randomized studies is so 1985....why are we still doing it?

References:

Altman, D.G. (1985), Comparability of Randomised Groups. Journal of the Royal Statistical Society: Series D (The Statistician), 34: 125-136. doi:10.2307/2987510

Austin,  PC. Balance diagnostics for comparing the distribution of baseline
covariates between treatment groups in propensity-score
matched sample. Statist. Med. 2009; 28:3083–3107

The performance of different propensity score methods for estimating marginal odds ratios.
Austin, PC. Stat Med. 2007 Jul 20; 26(16):3078-94.

Bolaji Emmanuel Egbewale. Statistical issues in randomised controlled trials: a narrative synthesis,
Asian Pacific Journal of Tropical Biomedicine. Volume 5, Issue 5,
2015,Pages 354-359,ISSN 2221-1691

Ho, Daniel E. and Imai, Kosuke and King, Gary and Stuart, Elizabeth A., Matching as Nonparametric Preprocessing for Reducing Model Dependence in Parametric Causal Inference. Political Analysis, Vol. 15, pp. 199-236, 2007, Available at SSRN: https://ssrn.com/abstract=1081983

Imai K, King G, Stuart EA. Misunderstandings among experimentalists and observationalists in causal inference. Journal of the Royal Statistical Society Series A. 2008;171(2):481–502.

Pocock SJ, Assmann SE, Enos LE, Kasten LE. Subgroup analysis, covariate adjustment and baseline comparisons in clinical trial reporting: current practice and problems. Stat Med. 2002;21(19):2917-2930. doi:10.1002/sim.1296

Stuart EA. Matching methods for causal inference: A review and a look forward. Stat Sci. 2010;25(1):1-21. doi:10.1214/09-STS313

Thoemmes, F. J. & Kim, E. S. (2011). A systematic review of propensity score methods in the social  sciences. Multivariate Behavioral Research, 46(1), 90-118.

Balance diagnostics after propensity score matching
Zhongheng Zhang1, Hwa Jung Kim2,3, Guillaume Lonjon4,5,6,7, Yibing Zhu8; written on behalf of AME Big-Data Clinical Trial Collaborative Group

Wednesday, May 6, 2020

Experimentation and Causal Inference: Strategy and Innovation

Knowledge is the most important resource in a firm and the essence of organizational capability, innovation, value creation, strategy, and competitive advantage. Causal knowledge is no exception.In previous posts I have discussed the value proposition of experimentation and causal inference from both mainline and behavioral economic perspectives. This series of posts has been greatly influenced by Jim Manzi's book 'Uncontrolled: The Surprising Payoff of Trial-and-Error for Business, Politics, and Society.' Midway through the book Manzi highlights three important things that experimentation and causal inference in business settings can do:

1) Precision around the tactical implementation of strategy
2) Feedback on the performance of a strategy and refinements driven by evidence
3) Achievement of organizational and strategic alignment

Manzi explains that within any corporation there are always silos and subcultures advocating competing strategies with perverse incentives and agendas in pursuit of power and control. How do we know who is right and which programs or ideas are successful, considering the many factors that could be influencing any outcome of interest?  Manzi describes any environment where the number of causes of variation are enormous as an environment that has 'high causal density.' We can claim to address this with a data driven culture, but what does that mean? How do we know what is, and isn't supported by data? Modern companies in a digital age with AI and big data are drowning in data. This makes it easy to adorn rhetoric in advanced analytical frameworks. Because data seldom speaks, anyone can speak for the data through wily data story telling.  Decision makers fail to make the distinction between just having data, and having evidence to support good decisions.

As Jim Manzi and Stefan Thomke discuss in Harvard Business Review:

"business experiments can allow companies to look beyond correlation and investigate causality....Without it, executives have only a fragmentary understanding of their businesses, and the decisions they make can easily backfire."

Without experimentation and causal inference, there is know way to connect the things we do with the value created. In complex environments with high causal density, we don't know enough about the nature and causes of human behavior, decisions, and causal paths from actions to outcomes to list them all and measure and account for them even if we could agree how to measure them. This is the nature of decision making under uncertainty. But, as R.A. Fisher taught us with his agricultural experiments, randomized tests allow us to account for all of these hidden factors (Manzi calls them hidden conditionals). Only then does our data stand a chance to speak truth. Experimentation and causal inference don't provide perfect information but they are the only means by which we can begin to say that we have data and evidence to inform the tactical implementation of our strategy as opposed to pretending that we do based on correlations alone. As economist F.A. Hayek once said:

"I prefer true but imperfect knowledge, even if it leaves much undetermined and unpredictable, to a pretense of exact knowledge that is likely to be false"

In Dual Transformation: How to Reposition Today's Business While Creating the Future authors discuss the importance of experimentation and causal inference as a way to navigate uncertainty in causally dense environments in what they refer to as transformation B:

“Whenever you innovate, you can never be sure about the assumptions on which your business rests. So, like a good scientist, you start with a hypothesis, then design and experiment. Make sure the experiment has clear objectives (why are you running it and what do you hope to learn). Even if you have no idea what the right answer is, make a prediction. Finally, execute in such a way that you can measure the prediction, such as running a so-called A/B test in which you vary a single factor."

Experiments aren't just tinkering and trying new things. While these are helpful to innovation, just tinkering and observing still leaves you speculating about what really works and is subject to all the same behavioral biases and pitfalls of big data previously discussed.

List and Gneezy address this in The Why Axis:

"Many businesses experiment and often...businesses always tinker...and try new things...the problem is that businesses rarely conduct experiments that allow a comparison between a treatment and control group...Business experiments are research investigations that give companies the opportunity to get fast and accurate data regarding important decisions."

Three things distinguish experimentation and causal inference from just tinkering:

1) Separation of signal from noise (statistical inference)
2) Connecting cause and effect  (causal inference)
3) Clear signals on business value that follows from 1 & 2 above

Having causal knowledge helps identify more informed and calculated risks vs. risks taken on the basis of gut instinct, political motivation, or overly optimistic and behaviorally biased data-driven correlational pattern finding analytics. 

Experimentation and causal inference add incremental knowledge and value to business. No single experiment is going to be a 'killer app' that by itself will generate millions in profits. But in aggregate the knowledge created by experimentation and causal inference probably offers the greatest strategic value across an enterprise compared to any other analytic method.

As discussed earlier, experimentation and causal inference creates value by helping manage the knowledge problem within firms, it's worth repeating again from List and Gneezy:

"We think that businesses that don't experiment and fail to show, through hard data, that their ideas can actually work before the company takes action - are wasting their money....every day they set suboptimal prices, place adds that do not work, or use ineffective incentive schemes for their work force, they effectively leave millions of dollars on the table."

As Luke Froeb writes in Managerial Economics, A Problem Solving Approach (3rd Edition):

"With the benefit of hindsight, it is easy to identify successful strategies (and the reasons for their success) or failed strategies (and the reason for their failures). It's much more difficult to identify successful or failed strategies before they succeed or fail."

Again from Dual Transformation:

"Explorers recognize they can't know the right answer, so they want to invest as little as possible in learning which of their hypotheses are right and which ones are wrong"

Experimentation and causal inference offer the opportunity to test strategies early on a smaller scale to get causal feedback about potential success or failure before fully committing large amounts of irrecoverable resources. They allow us to fail smarter and learn faster. Experimentation and causal inference play a central role in product development, strategy, and innovation across a range of industries and companies like Harrah's casinos, Capital One, Petco, Publix, State Farm, Kohl's, Wal-Mart, and Humana who have been leading in this area for decades in addition to new ventures like Amazon and Uber. 

"At Uber Labs, we apply behavioral science insights and methodologies to help product teams improve the Uber customer experience. One of the most exciting areas we’ve been working on is causal inference, a category of statistical methods that is commonly used in behavioral science research to understand the causes behind the results we see from experiments or observations...Teams across Uber apply causal inference methods that enable us to bring richer insights to operations analysis, product development, and other areas critical to improving the user experience on our platform." - From: Using Causal Inference to Improve the Uber User Experience (link)

Economist Joshua Angrist explains about his students that have went on to work for companies like Amazon: "when I ask them what are they up to they say...we're running experiments."

Achieving the greatest value from experimentation and causal inference requires leadership commitment.  It also demands a culture that is genuinely open to learning through a blend of trial and error, data driven decision making informed by theory and experiments, and the infrastructure necessary for implementing enough tests and iterations to generate the knowledge necessary for rapid learning and innovation. It requires business leaders, strategists, and product managers to think about what they are trying to achieve and asking causal questions to get there (vs. data scientists sitting in an ivory tower dreaming up models or experiments of their own). The result is a corporate culture that allows an organization to formulate, implement, and modify strategy faster and more tactfully than others.

See also:
Experimentation and Causal Inference: The Knowledge Problem
Experimentation and Causal Inference: A Behavioral Economics Perspective
Statistics is a Way of Thinking, Not a Box of Tools

Tuesday, April 21, 2020

Experimentation and Causal inference: A Behavioral Economic Perspective

In my previous post I discussed the value proposition of experimentation and causal inference from a mainline economic perspective. In this post I want to view this from a behavioral economic perspective. From this point of view experimentation and causal inference can prove to be invaluable with respect to challenges related to overconfidence and decision making under uncertainty.

Heuristic Data Driven Decision Making and Data Story Telling

In a fast paced environment, decisions are often made quickly and often based on gut decisions. Progressive companies have tried as much as possible to leverage big data and analytics to be data driven organizations. Ideally, leveraging data would help to override biases and often gut instincts and ulterior motives that may stand behind a scientific hypothesis or business question. One of the many things we have learned from behavioral economics is that humans tend to over interpret data into unreliable patterns that lead to incorrect conclusions. Francis Bacon recognized this over 400 years ago:

"the human understanding is of its own nature prone to suppose the existence of more order and regularity in the world than it finds" 

Anyone can tell a story with data. And with lots of data a good data story teller can tell a story to support any decision they want, good or bad. Decision makers can be easily duped by big data, ML, AI, and various BI tools into thinking that their data is speaking to them. As Jim Manzi and Stefan Thomke state in Harvard Business Review in the absence of experimentation and causal inference

"executives end up misinterpreting statistical noise as causation—and making bad decisions"

Data seldom speaks, and when it does it is often lying. This is the impetus behind the introduction of what became the scientific method. The true art and science of data science is teasing out the truth, or what version of truth can be found in the story being told. I think this is where experimentation and causal inference are most powerful and create the greatest value in the data science space. John List and Uri Gneezy discuss this in their book 'The Why Axis.' 

"Big data is important, but it also suffers from big problems. The underlying approach relies heavily on correlations, not causality. As David Brooks has noted, 'A zillion things can correlate with each other depending on how you structure of the data and what you compare....because our work focuses on field experiments to infer causal relationships, and because we think hard about these causal relationships of interest before generating the data we go well beyond what big data could ever deliver."

Decision Making Under Uncertainty, Risk Aversion, and The Dunning-Kruger Effect

Kahneman (in Thinking Fast and Slow) makes an interesting observation in relation to managerial decision making. Very often managers reward peddlers of even dangerously misleading information (data charlatans) while disregarding or even punishing merchants of truth. Confidence in a decision is often based more on the coherence of a story than the quality of information that supports it. Those that take risks based on bad information, when it works out, are often rewarded. To quote Kahneman:

"a few lucky gambles can crown a reckless leader with a Halo of prescience and boldness"

The essence of good decision science it understanding and seriously recognizing risk and uncertainty. As Kahneman discusses in Thinking Fast and Slow, those that often take the biggest risks are not necessarily any less risk averse, they simply are often less aware of the risks they are actually taking.  This leads to overconfidence and lack of appreciation for uncertainty, and a culture where a solution based on pretended knowledge is often preferred and even rewarded. Its easy to see how the Dunning-Kruger effect would dominate. This feeds a viscous cycle that leads to collective blindness toward risk and uncertainty. It leads to taking risks that should be avoided in many cases, and prevents others from considering smarter calculated risks.  Thinking through an experimental design (engaging Kahneman's system 2) provides a structured way of thinking about business problems and all the ways our biases and the data can fool us..  In this way experimentation and causal inference can ensure a better informed risk appetite to support decision making.

Just as rapid cycles of experiments in a business setting can aid in the struggle with the knowledge problem, experimentation and causal inference can aid us in our struggles with biased decision making and biased data.  Data alone doesn't make good decisions because good decisions require something outside the data. Good decision science leverages experimentation and causal inference that brings theory and subject matter expertise together with data so we can make better informed business decisions in the face of our own biases and the biases in data.

A business culture that supports risk taking coupled with experimentation and causal inference will come to value a preferred solution over pretended knowledge. That's valuable. 


See also:


Monday, April 20, 2020

Experimentation and Causal Inference Meet the Knowledge Problem

Why should firms leverage experimentation and causal inference? With recent advancements in computing power and machine learning, why can't they simply base all of their decisions on predictions or historical patterns discovered in the data using AI?  Perhaps statisticians and econometricians and others have a simple answer. The kinds of learnings that will help us understand the connections between decisions and the value we create require understanding causality. This requires something that may not be in the data to begin with. Experimentation and causal inference may be the best (if not the only) way of answering these questions. In this series of posts I want to focus on a number of fundamental reasons that experimentation and causal inference are necessary in business settings from the perspective of both mainline and behavioral economics:

Part 1: The Knowledge Problem
Part 2:  Behavioral Biases
Part 3:  Strategy and Tactics

In this post I want to discuss the value of experimentation and causal inference from a basic economic perspective. The fundamental problem of economics, society, and business is the knowledge problem. In his famous 1945 American Economic Review article The Use of Knowledge in Society, Hayek argues:

"the economic problem of society is not merely a problem of how to allocate 'given resources'....it is a problem of the utilization of knowledge which is not given to anyone in its totality."

A really good parable explaining the knowledge problem is the essay I, Pencil by Leonard E. Read. The fact that no one person possesses the necessary information to make something that seems so simple as a basic number 2 pencil captures the essence of the knowledge problem.

If you remember your principles of economics, you know that the knowledge problem is solved by prices which reflect tradeoffs based on the disaggregated incomplete and imperfect knowledge and preferences of millions (billions) of individuals. Prices serve both the function of providing information and the incentives to act on that information. It is through this information creation and coordinating process that prices help solve the knowledge problem. Prices solve the problem of calculation that Hayek alluded to in his essay, and they are what coordinate all of the activities discussed in I, Pencil. 

In Living Economics: Yesterday, Today, and Tommorow by Peter J. Boettke, discusses the knowledge problem in the context of firms and the work of economist Murray Rothbard:

"firms cannot vertically integrate without facing a calculation problem....vertical integration eliminates the external market for producer goods."

 Coase, also recognized that as firms integrate to eliminate transactions costs they also eliminate the markets which generate the prices that solve the knowledge problem! This tradeoff has to be managed well or firms go out of business. In a way firms could be viewed as little islands with socially planned economies in a sea of market competition. As Luke Froeb masterfully illustrates in his text Managerial Economics: A Problem Solving Approach (3rd Ed), decisions within firms in effect create regulations, taxes, and subsidies that destroy wealth creating transactions. Managers should make decisions that consummate the most wealth creating transactions (or do their best not to destroy, discourage, or prohibit wealth creating transactions).

So how do we solve the knowledge problems in firms without the information creating and coordinating role of prices? Whenever mistakes are made, Luke Froeb provides this problem solving algorithm that asks:

1) Who is making the bad decision?
2) Do they have enough information to make a good decision?
3) Do they have the incentive to make a good decision?

In essence, in absence of prices, we must try to answer the same questions that market processes often resolve. And we could leverage experimentation and causal inference to address each of the questions above:

How do we know a decision was good or bad to begin with? 
How do we get the information to make a good decision? 
What incentives or nudges work best to motivate good decision making? 

What does failure to solve the knowledge problem in firms look like in practical terms? Failure to consummate wealth creating transactions implies money left on the table - but experimentation and causal inference can help us figure out how to reclaim some of these losses. List and Gneezy address this in The Why Axis:

"We think that businesses that don't experiment and fail to show, through hard data, that their ideas can actually work before the company takes action - are wasting their money....every day they set suboptimal prices, place adds that do not work, or use ineffective incentive schemes for their work force, they effectively leave millions of dollars on the table."

Going back to I, Pencil and Hayek's essay, the knowledge problem is solved through the spontaneous coordination of multitudes of individual plans via markets. Through a trial and error process where feedback is given through prices, the plans that do the best job coordinating peoples choices are adopted. Within firms there are often only a few plans compared to the market and these are in the form of various strategies and tactics. But as discussed in Jim Manzi's book Uncontrolled, firms can mimic this trial and error feedback process through iterative experimentation.

While experimentation and causal inference cannot perfectly emulate the same kind of evolutionary feedback mechanisms prices deliver in market competition, an iterative test and learn culture within a business may provide the best strategy for dealing with the knowledge problem. And that is one of many ways that experimentation and causal inference can create value.

Monday, April 6, 2020

Statistics is a Way of Thinking, Not Just a Box of Tools

If you have taken very many statistics courses you may have gotten the impression that it's mostly a mixed bag of computations and rules for conducting hypothesis tests or making predictions or creating forecasts. While this isn't necessarily wrong, it could leave you with the opinion that statistics is mostly just a box of tools for solving problems. Absolutely statistics provides us with important tools for understanding the world, but to think of statistics as 'just tools' can have some pitfalls (besides the most common pitfall of having a hammer and viewing every problem as a nail)

For one, there is a huge gap between the theoretical 'tools' and real world application. This gap is filled with critical thinking, judgment calls, and various social norms, practices, and expectations that differ from field to field, business to business, and stakeholder to stakeholder. The art and science of statistics is often about filling this gap. That's a stretch more than 'just tools.'

The proliferation of open source programming languages (like R and Python) and point and click automated machine learning solutions (like DataRobot and H2Oai) might give the impression that after you have done your homework in framing the business problem, data and feature engineering, then all that is left is hyper-parameter tuning and plugging and playing with a number of algorithms until the 'best' one is found. It might reduce to a mechanical (sometimes time consuming if not using automated tools) exercise. The fact that a lot of this work can in fact be automated probably contributes to the 'toolbox' mentality when thinking about the much broader field of statistics as a whole. In The Book of Why, Judea Pearl provides an example explaining why statistical inference (particularly causal inference) problems can't be reduced to easily automated mechanical exercises:

"path analysis doesn't lend itself to canned programs......path analysis requires scientific thinking as does every exercise in causal inference. Statistics, as frequently practiced, discourages it and encourages "canned" procedures instead. Scientists will always prefer routine calculations on data to methods that challenge their scientific knowledge."

Indeed, a routine practice that takes a plug and play approach with 'tools' can be problematic in many cases of statistical inference. A good example is simply plugging GLM models into a difference-in-differences context. Or combining matching with difference-in-differences. While we can get these approaches to 'play well together' under the correct circumstances its not as simple as calling the packages and running the code. Viewing methods of statistical inference and experimental design as just a box of tools to be applied to data could leave one open to the plug and play fallacy. There are times you might get by with using a flathead screwdriver to tighten up a phillips head screw, but we need to understand that inferential methods are not so easily substituted even if it looks like a snug enough fit on the surface.

Understanding the business problem and data story telling are in fact two other areas of data science that would be difficult to automate . But don't let that fool you into thinking that the remainder of data science including statistical inference is simply a mechanical exercise that allows one to apply the 'best' algorithm to 'big data'. You might get by with that for a minority set of use cases that require a purely predictive or pattern finding solution but the remainder of the world's problems are not so tractable. Statistics is about more than data or the patterns we find in it. It's a way of thinking about the data.

"Causal Analysis is emphatically not just about data; in causal analysis we must incorporate some understanding of the process that produces the data and then we get something that was not in the data to begin with." - Judea Pearl, The Book of Why

Statistics is A Way of Thinking

In their well known advanced text book "Principles and Procedures of Statistics, A Biometrical Approach", Steel and Torrie push back on the attitude that statistics is just about computational tools:

"computations are required in statistics, but that is arithmetic, not mathematics nor statistics...statistics implies for many students a new way of thinking; thinking in terms of uncertainties of probabilities.....this fact is sometimes overlooked and users are tempted to forget that they have to think, that statistics cannot think for them. Statistics can however help research workers design experiments and objectively evaluate the resulting numerical data."

At the end of the day we are talking about leveraging data driven decision making to override biases and often gut instincts and ulterior motives that may stand behind a scientific hypothesis or business question.  Objectively evaluating numerical data as Steel and Torrie put it above. But what do we actually mean by data driven decision making? Mastering (if possible) statistics, inference, and experimental design is part of a lifelong process of understanding and interpreting data to solve applied problems in business and the sciences. It's not just about conducting your own analysis and being your own worst critic, but also about interpreting, criticizing, translating and applying the work of others. Biologist and geneticist Kevin Folta put this well once in a Talking Biotech podcast:

"I've trained for 30 years to be able to understand statistics and experimental design and interpretation...I'll decide based on the quality of the data and the experimental design....that's what we do."

In 'Uncontrolled' Jim Manzi states:

"observing a naturally occurring event always leaves open the possibility of confounded causes...though in reality no experimenter can be absolutely certain that all causes have been held constant the conscious and rigorous attempt to do so is the crucial distinction between an experiment and an observation."

Statistical inference and experimental design provide us with a structured way to think about real world problems and the data we have to solve them while avoiding as much as possible the gut based data story telling that intentional or not, can sometimes be confounded and misleading. As Francis Bacon once stated:

"what is in observation loose and vague is in information deceptive and treacherous"

Statistics provides a rigorous way of thinking that moves us from mere observation to useful information.

*UPDATE: Kevin Gray wrote a very good article that really gets at the spirit of a lot of what I wanted to convey in this post.

https://www.linkedin.com/pulse/statistical-thinking-nutshell-kevin-gray/

See also:

To Explain or Predict

Applied Econometrics